QQ PLOTS & Regression line
Data: download
#Set margin
par(mar=c(5,6,4,2)+0.1)
b.data <- read.table(“qqplot.csv”, header=T,fill=T)
library(car)
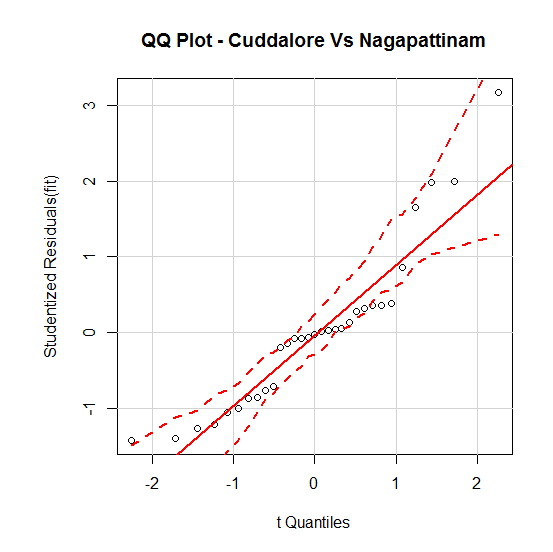
fit <- lm(Cuddalore~Nagapattinam, data=b.data)
qqPlot(fit, main=”QQ Plot – Cuddalore Vs Nagapattinam”)