Data: Download
R Script
b.data <- read.table(“scatterogram.csv”, header=T,fill=T)
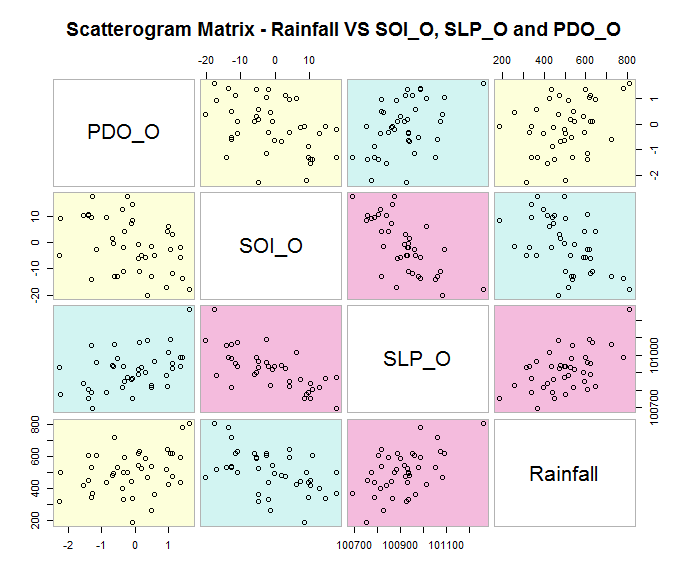
# Scatterplot Matrices from the glus Package
library(gclus) # call gclus package
dta <- b.data[c(5,4,3,2)] # get data
dta.r <- abs(cor(dta)) # get correlations
dta.col <- dmat.color(dta.r) # get colors
# reorder variables so those with highest correlation
# are closest to the diagonal
dta.o <- order.single(dta.r)
cpairs(dta, dta.o, panel.colors=dta.col, gap=.5,
main=”Scatterogram Matrix – Rainfall VS SOI_O, SLP_O and PDO_O” ) # plot title