Data:download
R Script
par(mar=c(5,6,4,3)+0.1) # set marigin
b.data <- read.table(“3dscatterogram.csv”, header=T,fill=T) # read input data
attach(b.data)
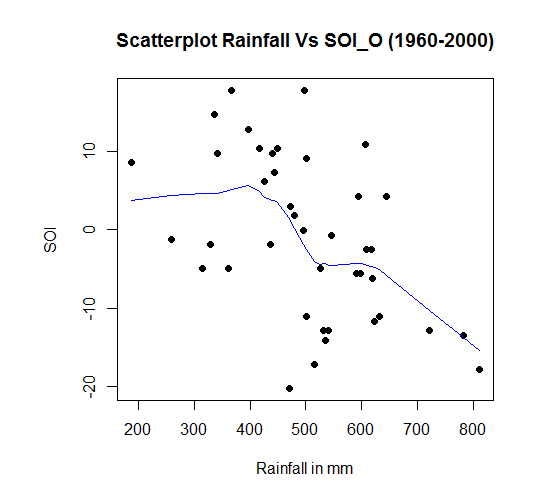
plot(Rainfall, SOI_O, main=”Scatterplot Rainfall Vs SOI_O (1960-2000)”, xlab=”Rainfall in mm”, ylab=”SOI”, pch=19) # plot function
# Fit planes
abline(lm(Rainfall~SOI_O), col=”red”) # regression line (y~x)
lines(lowess(Rainfall,SOI_O), col=”blue”) # lowess line (x,y)