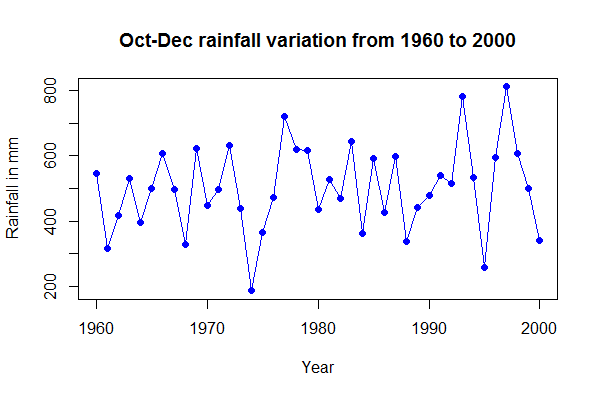
Interannual variation of OND rainfall
Data: download
#Read data
b.data <- read.table(“timeseries.csv”, header=T,fill=T)
# Scatterplot Matrices from the glus Package
attach(mtcars)
#library(gclus)
library(scatterplot3d)
attach(b.data)
# TIMESERIES1
plot(Rainfall~Year, cex = 1, col = “blue”, type=”o”, pch=19, ylab=”Rainfall in mm”, main = “Oct-Dec rainfall variation from 1960 to 2000”)