Data: Download
R Script
#Read input data
b.data <- read.table(“boxplot.csv”, header=T,fill=T)
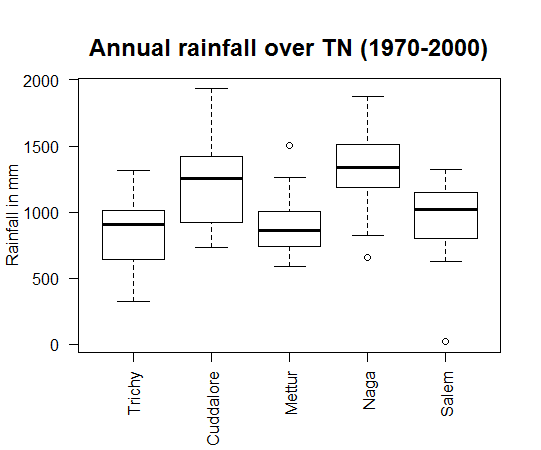
# Plot boxplot in single color
#boxplot(b.data,ylab =”Rainfall in mm”, las = 2, at =c(1,2,3,4,5), names = c(“Trichy”,”Cuddalore”,”Mettur”,”Naga”,”Salem”))
# Plot boxplot in multi color
boxplot(b.data,ylab =”Rainfall in mm”, col = c(“red”,”sienna”,”palevioletred1″,”royalblue2″,”orange”),las = 2, at =c(1,2,3,4,5), names = c(“Trichy”,”Cuddalore”,”Mettur”,”Naga”,”Salem”),boxwex = 0.5, notch = T)
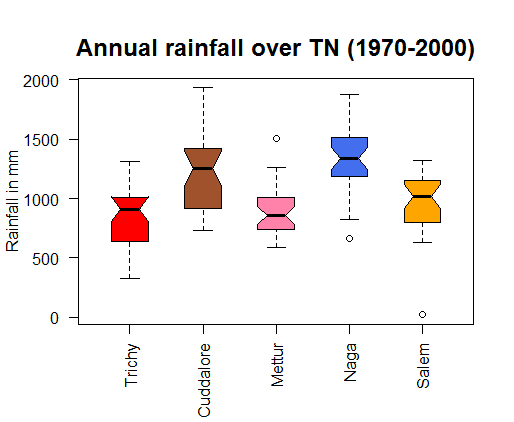
# Add headings to the plot
mtext(“Annual rainfall over TN (1970-2000)”, side = 3, line = 1, cex = 1.5, font = 2)